Tutorial

PTVis provides functions attaching the periodic table to a figure object of Plotly, which are

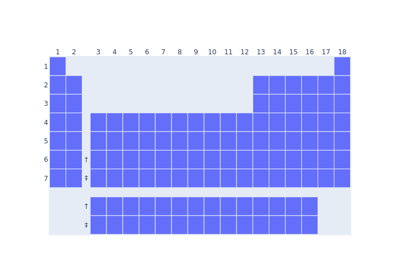
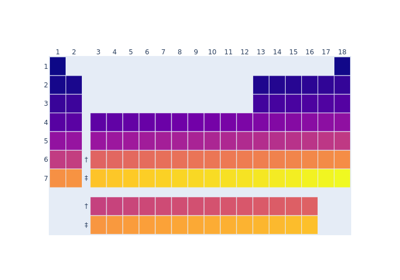
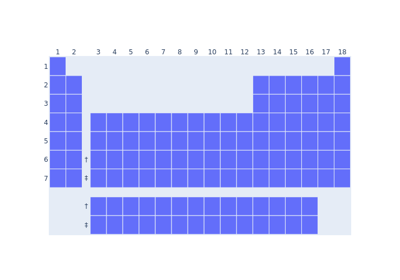
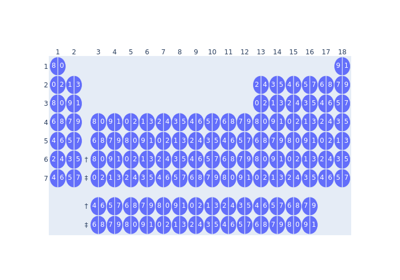
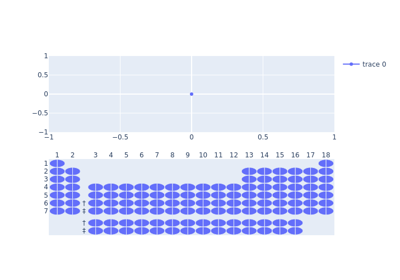
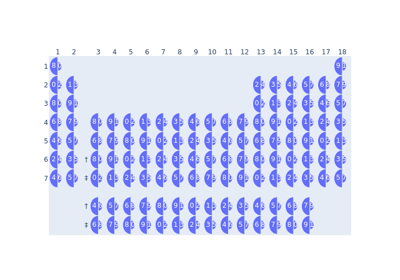
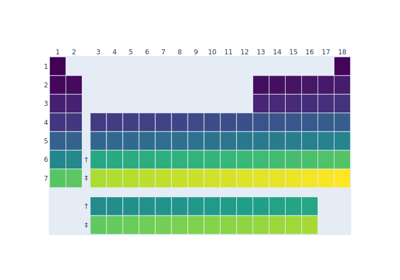
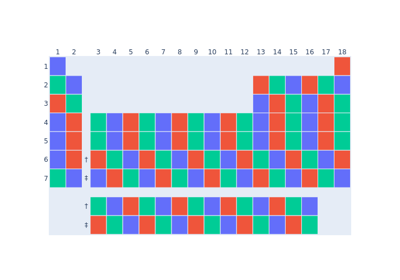
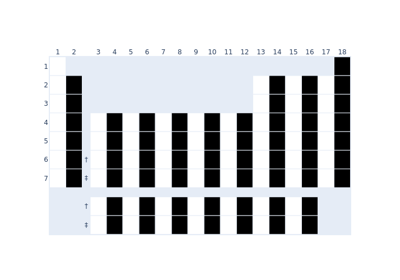
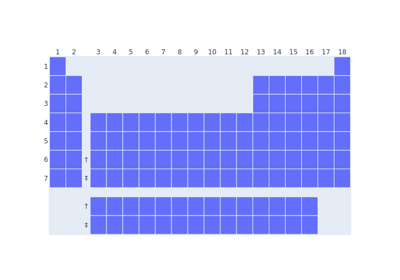
ptvis.attach_plain_cells()

Attach the periodic table with plain cells.

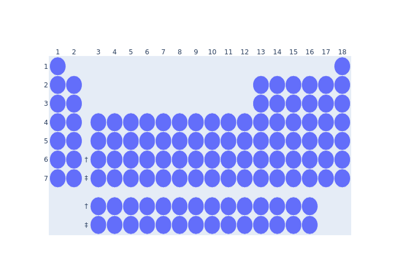
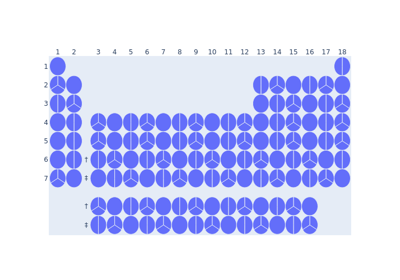
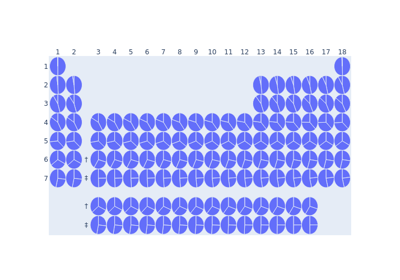
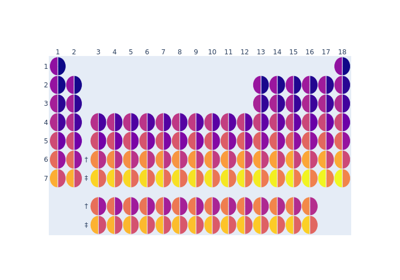
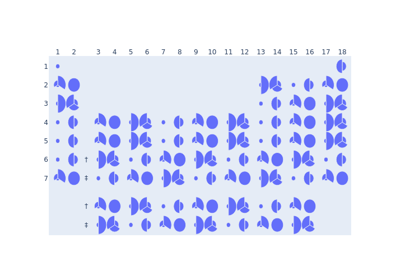
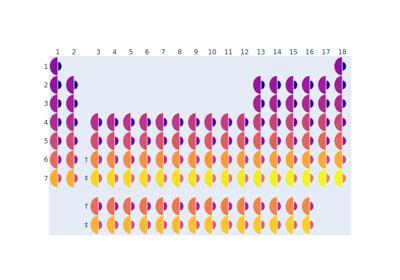
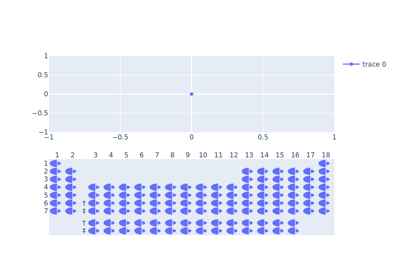
ptvis.attach_pie_cells()

Attach the periodic table with pie chart cells.

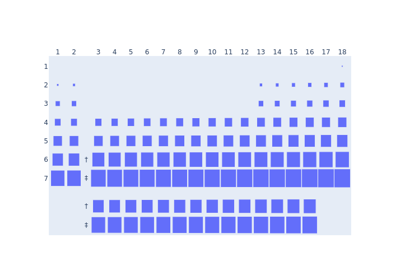
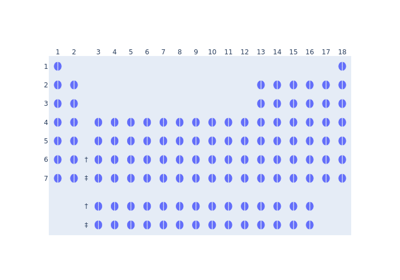
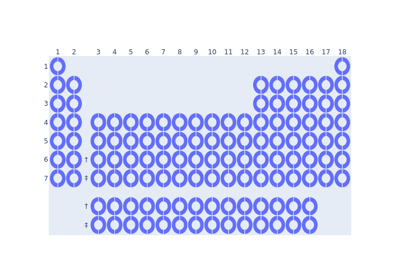
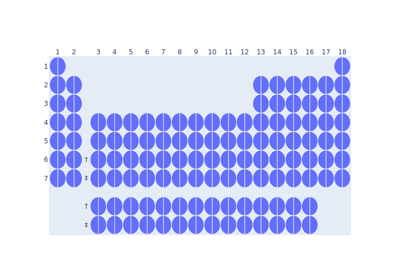
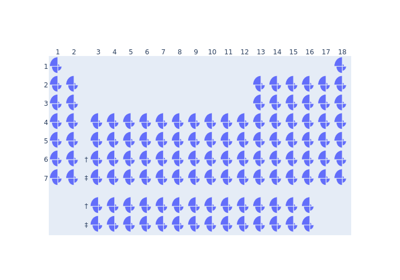
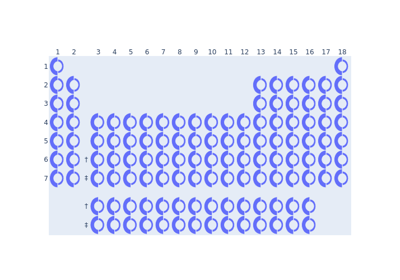
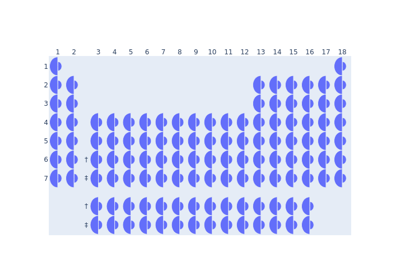
ptvis.attach_polar_bar_cells()

Attach the periodic table with polar bar chart cells.

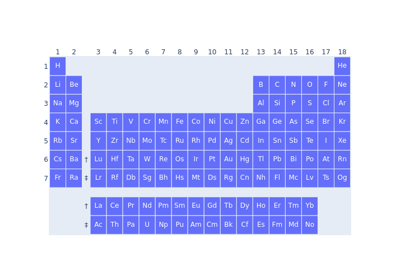
PTVis also provides the ptvis.Element class to specify chemical elements in these functions.

Periodic table with plain cells

Basics

Basics

Cell shape

Cell shape

Bubble chart

Bubble chart

Cell text

Cell text

Cell color

Cell color

Tooltip

Tooltip

Table layout

Table layout

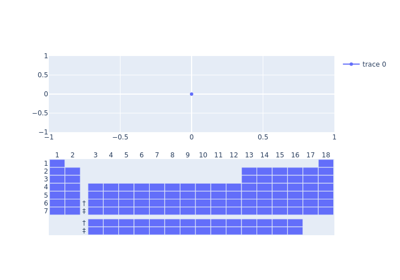
Subplot

Subplot

Periodic table with pie chart cells

Basics

Basics

Sector proportion

Sector proportion

Cell size

Cell size

Doughnut charts

Doughnut charts

Sector text

Sector text

Sector color

Sector color

Tooltip

Tooltip

Table layout

Table layout

Subplot

Subplot

Periodic table with polar bar chart cells

Basics

Basics

Radius range

Radius range

Cell hole

Cell hole

Sector text

Sector text

Sector color

Sector color

Tooltip

Tooltip

Table layout

Table layout

Subplot

Subplot

Color conversion

A color must be given as a CSS color.
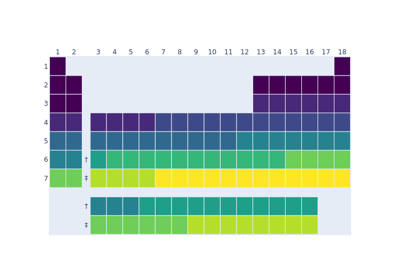
From numerical values to continuous colors

From numerical values to continuous colors

From numerical values to discrete colors

From numerical values to discrete colors

From categories

From categories

Leave values as they are

Leave values as they are

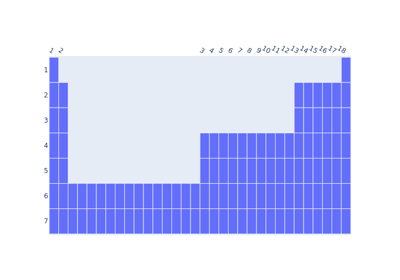
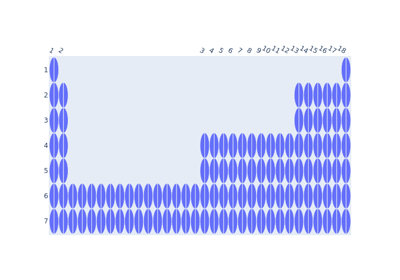
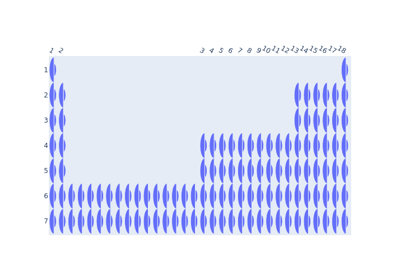
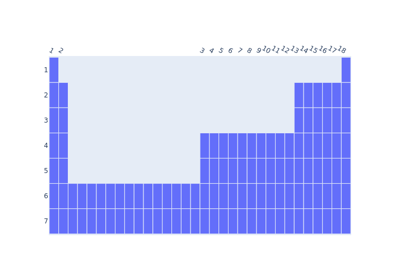
Table layout

Separated layout

Separated layout

Unified layout

Unified layout

Gallery generated by Sphinx-Gallery